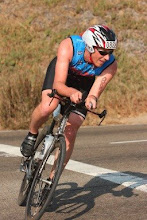
The course is a 112 mile route consisting of an out and back loop which is repeated 3 times.

As you can see, the course is pretty flat - it climbs about 500 feet over 18.6 miles, then you turn around and go back down. Rinse and repeat 3 times, and you're done. Obviously the uphill section is more difficult than the downhill section, so I'm going to break it down into 6 segments: the three climbs, and the three descents.
First, lets look at the power, heart rate and speed data for the climbs on each loop.
climb 1: 198 watts 152 bpm 18.5 mph
climb 2: 180 watts 140 bpm 16.9 mph
climb 3: 157 watts 133 bpm 17.8 mph
My plan was to go out easy on the first loop, hammer the second, and go easy again on the third. Boy was I off - I knew as I was racing that I had gone out too hard. But I felt so good, I was racing Ironman! As you can see clearly I got progressively weaker during the ride, which is not good. However, even in this very small and controlled set of data there are variables to consider. Notice how between lap 1 and lap 3 I decreased my power by over 20%, but my speed only decreased by 4%. Turns out I was working much harder on lap 1 because it was into a headwind, which by lap 3 had died down. The important number here is the power - I was targeting 180 watts, and my average for the race was only 163. Clearly I went out too hard, and by the end I couldn't hold my numbers. I didn't notice this while I was racing, I felt good the whole way.
However, if you look at the power distribution chart, I wasn't so far off my 180 watt target after all.

Well look at that - my power distribution is centered right on 180 watts. The average is being dragged down because I spent 6.5% of the ride (22 minutes) coasting below 20 watts! This was deliberate as I was only trying to average 18.6 MPH for the ride (6 hours) and I figured if I could rest my legs while still going fast, I would do it.
Here are the descent numbers
descent 1: 165 watts 139 bpm 25.1 mph
descent 2: 148 watts 133 bpm 23.0 mph
descent 3: 125 watts 124 bpm 19.6 mph
Not much to say about these. Lap 1 included a tailwind, which lessened as the day went on. The wattage numbers aren't as important here since I was coasting as much as I could to rest - especially on lap 3. You can see this clearly in the heart rate trend.
Another interesting observation is that my highest power output over 30 minutes occurred between minutes 2 and 32. Also, my highest 60 minute power section was between minutes 0 and 60. This means I need to work on pacing, I really need to judge my effort better so I can be more consistent over a long ride.
My overall numbers were:
Distance: 112.2 miles
Time: 5:42:04
Speed: 19.7 MPH
Power: 163 watts
Cadence: 86 rpm
I spoke to a pro before the race who told me his plan was to average 300 watts. Are you kidding me?! It's too early to start thinking about specifics, but I'd like to get up near the 200 range for an Ironman bike course this year. I guess we'll see in a few months.


1 comment:
Hi,
Superb. Nice information.
The places are nice. Enjoyable blog.
Cool blog and keep it up.
:-)
pet insurance
Post a Comment